 Where to find the cluster analysis output
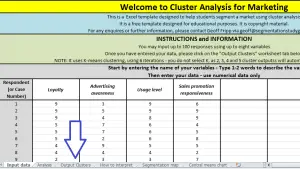
Just in case you are new to Excel, you will need to click on the “Output Clusters” tab near the bottom of the spreadsheet, as shown in this diagram.
Outputs for a different number of segments provided
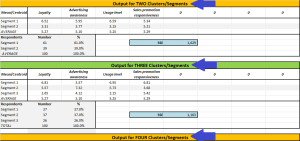
 This Excel template automatically provides the output of cluster analysis for two to five market segments at the one time. In most statistical packages you need to first nominate the number of viable market segments (referred to as “k”) that you think that there are, and then run cluster analysis.
In the case of this template, multiple market segments are run at the same time for ease of comparison and improved understanding of the cluster analysis concept – please note the blue arrows in the excerpt from the Excel template.
Important to review
How to use/interpret…
- Understanding the market segments from the averages of the marketing variables
- Using segment sizes
- Sum of squared error (SSE)
- The segmentation map
- The central means chart